
Service Spotlight: Monthly Reports
Welcome to the Ask Approach Service Spotlight. Each month in 2020 we’ll take an in-depth look at a different service offered by Approach. For a quick look at all of the services available to Approach clients, download our Approach Services infographic.
Find all of our Service Spotlight posts at https://www.pitb.com/category/ask-approach/service-spotlight/
Monthly Claim and Safety Snapshots from Approach
Each month, we send our clients a snapshot of their claim and safety trends. Your monthly Composite Claims Report is a great tool for HR, safety professionals, and even your management or ownership team. The April report will be in your inbox next week, so let’s take a closer look at the valuable information you’ll find inside.
Tip: To find your monthly report, look for an email with the subject – “Your Company Name Composite Claims Report”
Up-to-Date Claims Status Reports
A workers’ comp claim can impact your rates for three to five years, plus reduce your Retro refunds for three years. So, we provide a look at any claims in the years that can affect your rates and refunds. At a glance, you can see:
- Which claims are open and which have closed
- Where costs are rising
- Number of low-cost “medical only” claims vs expensive claims with time-loss or other costly factors
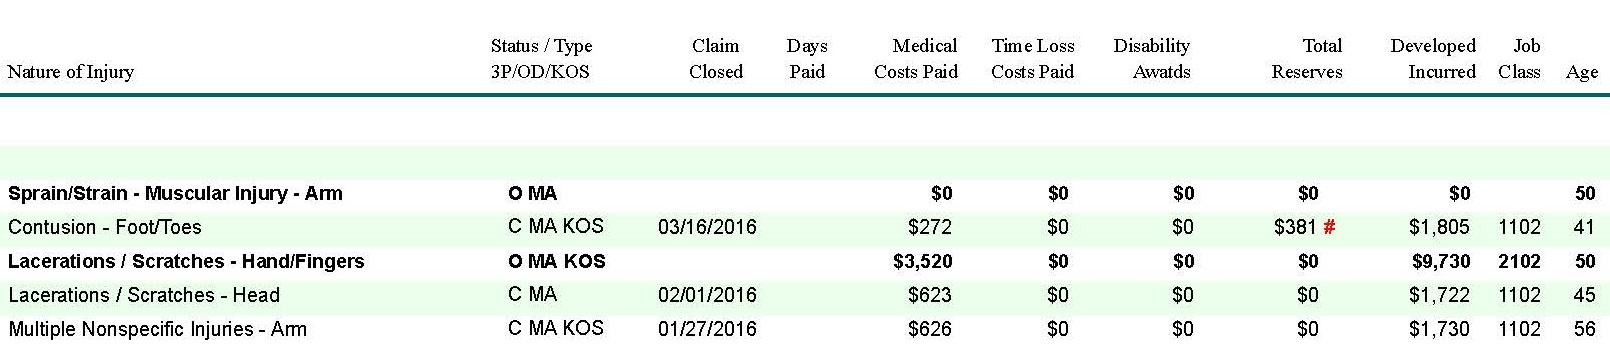
This report shows open claims in bold. We can also see that this employer uses Kept-on-Salary, or KOS, to keep their claims costs as low as possible.
Survey: Already using your monthly composite report? Answer a few quick questions to help us improve!
Executive Summary
Next, in the monthly report, is an executive summary page, showing the number of claims and total cost of claims for each year. This gives management and owners the quickest possible look at injury trends and the costs of those injuries over time.
Accident Reports and Safety Trends
There’s an enormous amount of data captured whenever a workplace accident occurs. (This may not be surprising considering the amount of paperwork involved!) At Approach, we use this data to provide you with informative visual-based charts and graphs that can help you reduce workplace accidents and injuries.
For example, your report might show a higher rate of slip and fall injuries, allowing your safety team (or ours!) to address this trend with new procedures, training or equipment. We even help you identify hidden trends such as:
- Days of the week with higher accident rates
- Accident-prone job titles or classifications
- Injury types resulting in higher claim costs
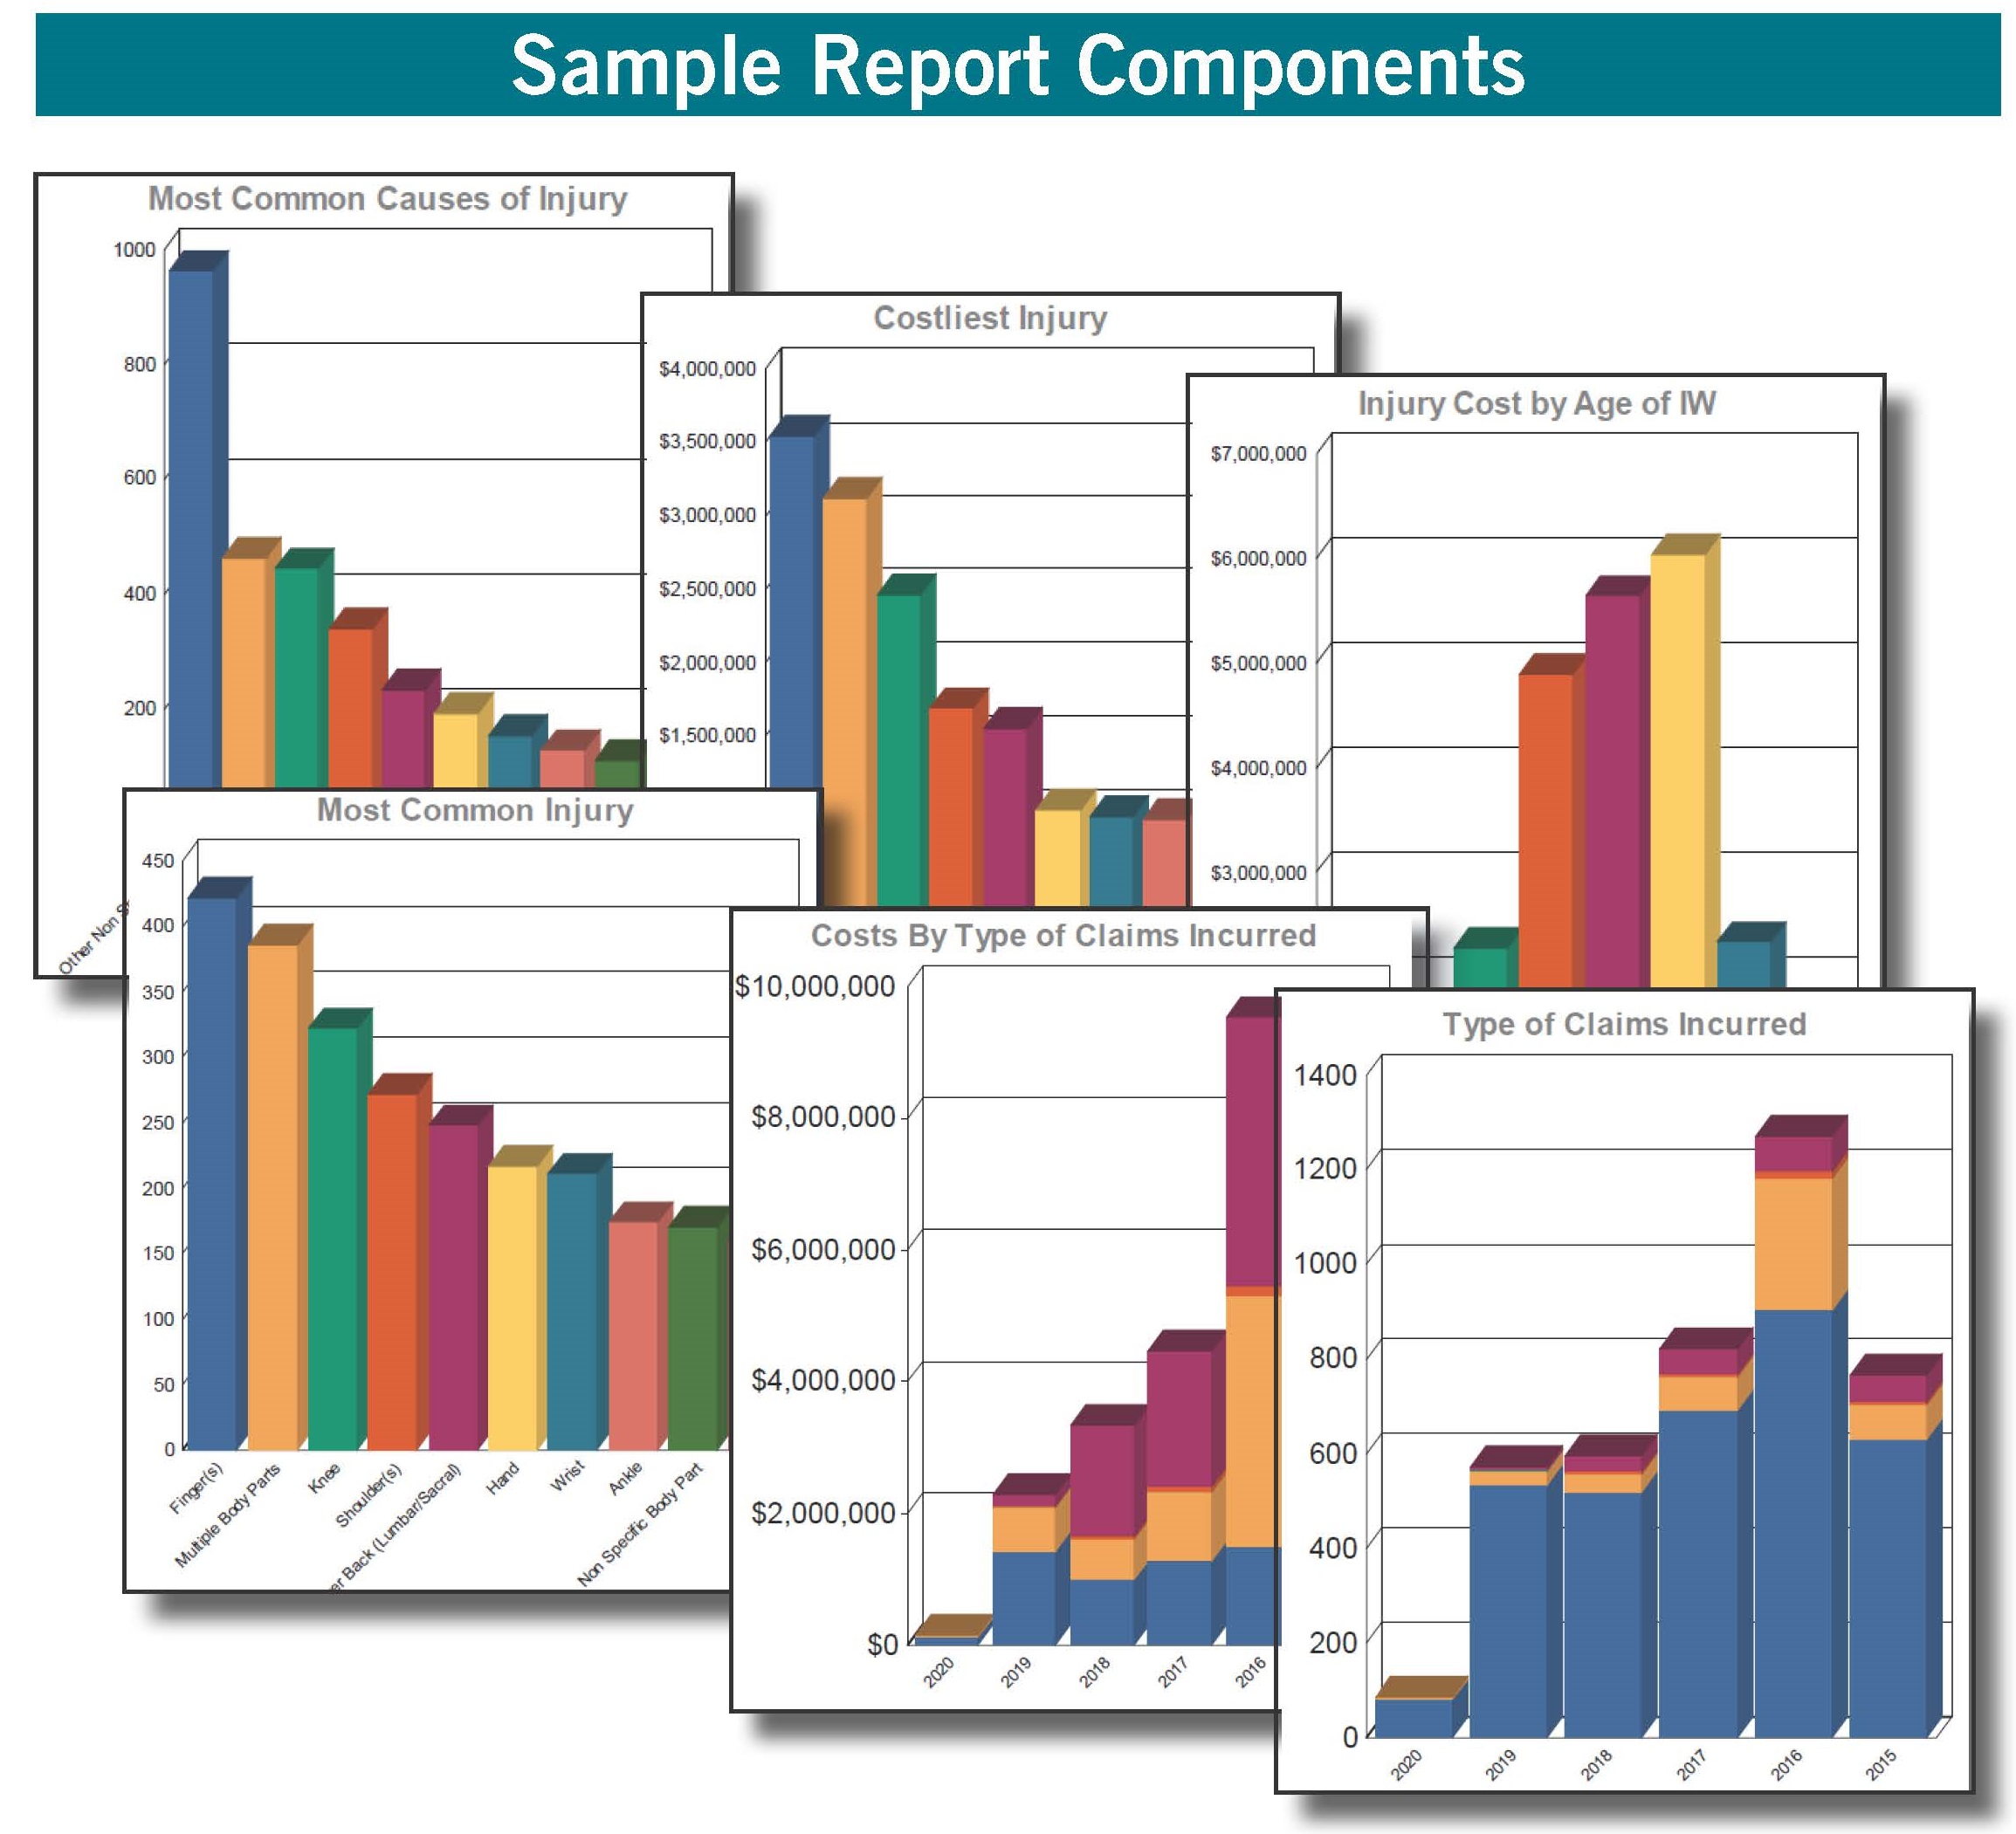
Print this flyer with sample reports
Custom Reports and Analysis
These monthly reports are just one example of how we use data at Approach to achieve leading results for our clients. And, customization is easy and available at no extra charge. Just contact your Approach Retro Coordinator for:
- A custom monthly report with the specific metrics that are important to you
- On-demand reports to help support your decisions on specific claims
- Analysis of safety and financial trends in your organization or industry
Already using your monthly composite report? Answer a few quick questions to help us improve!